Using the Accident Explorer Tool
The Avalanche Explorer displays fatal avalanche accidents in Colorado from December 2009 to the present. For more information on the avalanche accident dataset and summaries of fatal accidents in the U.S. and Colorado, go to our Statistics & Reporting page.
Tool Overview
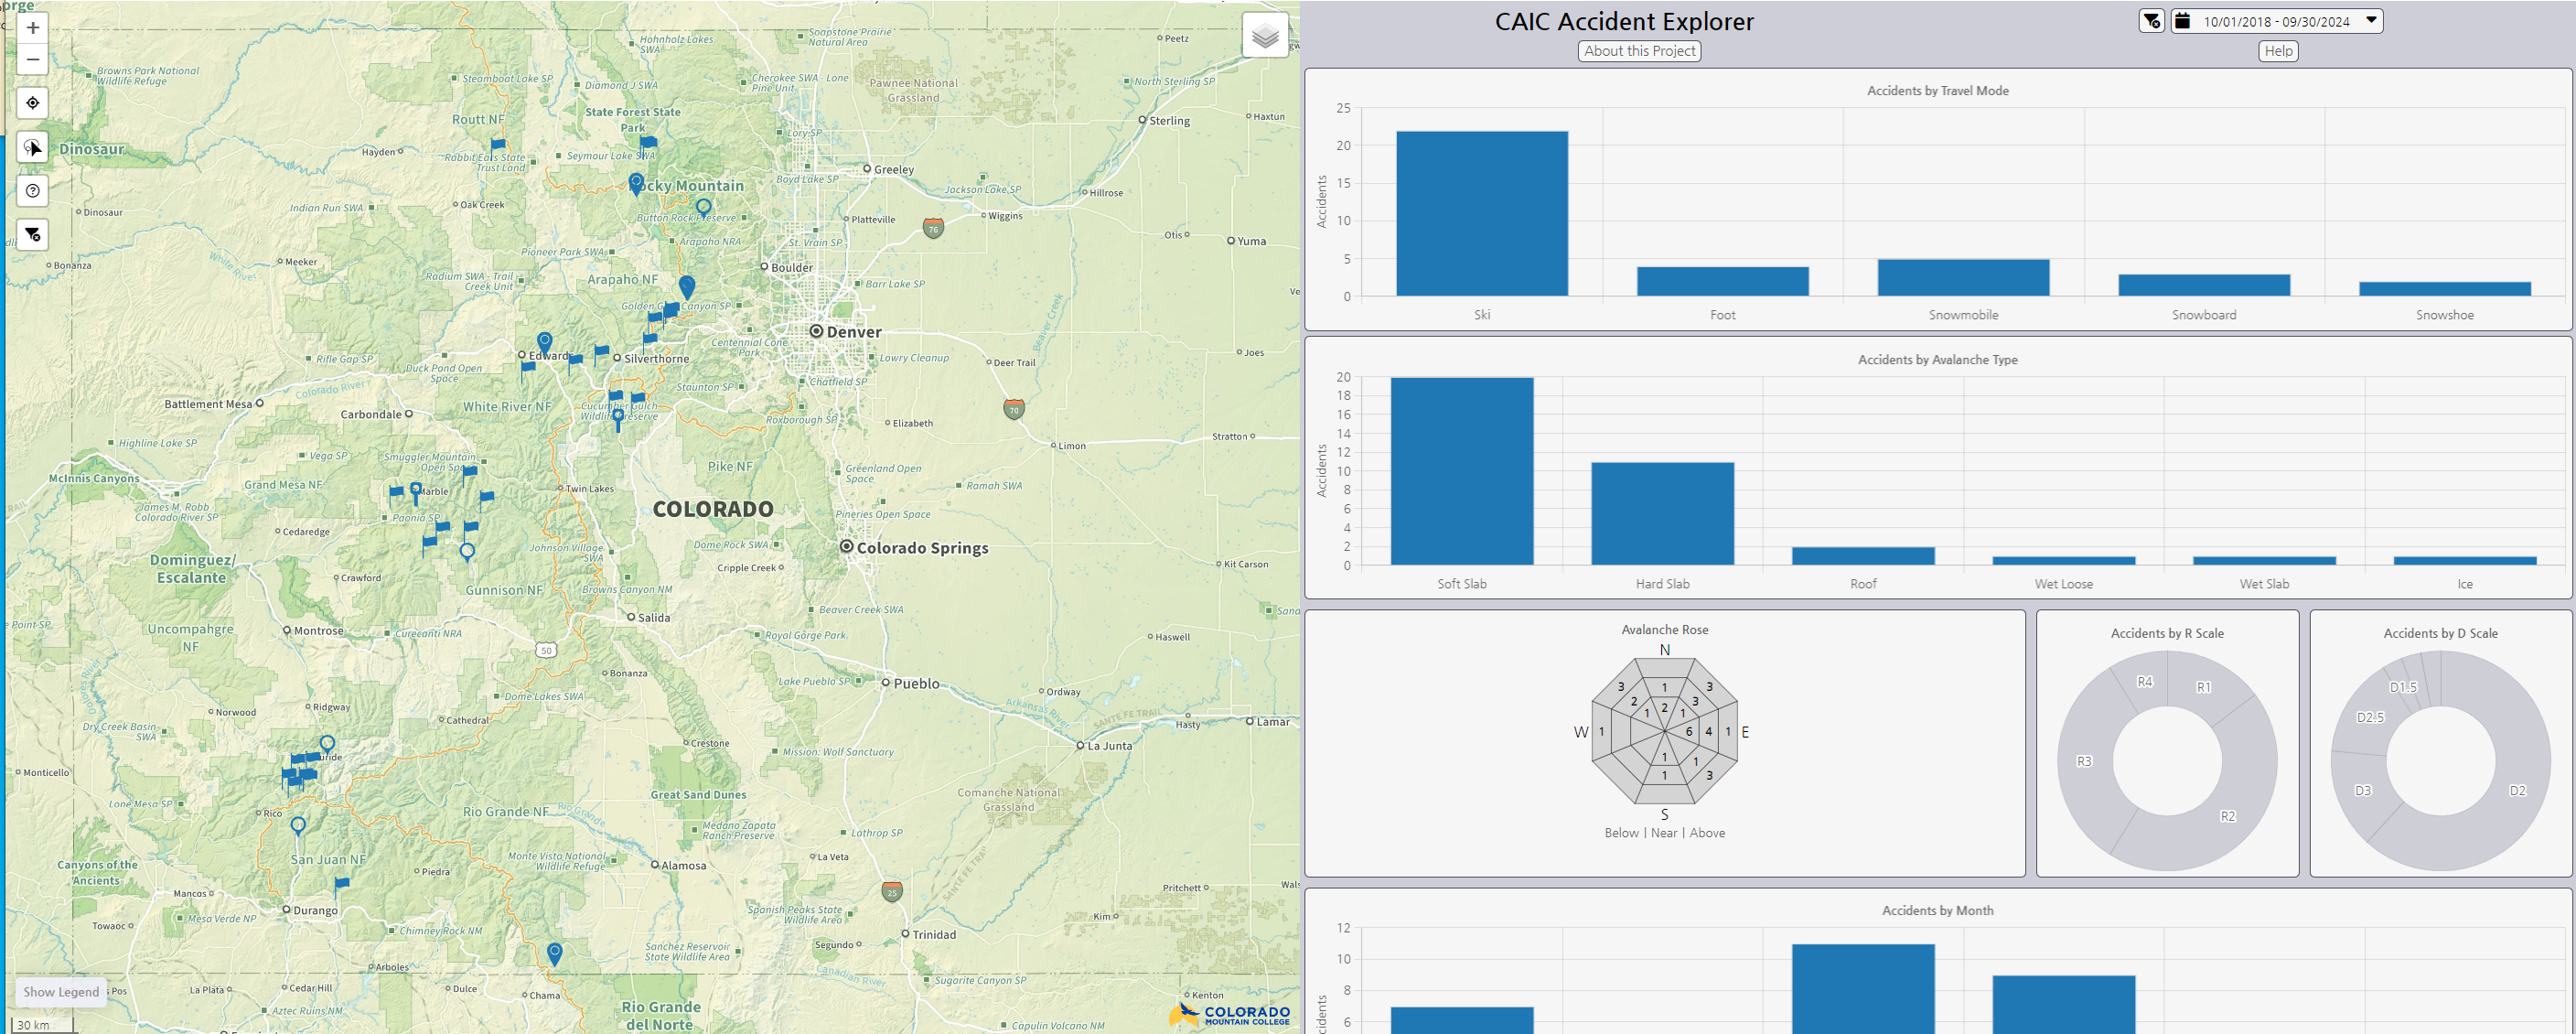
The Accident Explorer includes an interactive map on the left and a series of connected charts on the right (below the map on small screens). The page will start with accidents within the last five avalanche years (October 1 through September 30). You can change the date range at the top of the chart panel. You can filter the accident records by clicking on the charts. You can select accidents from a specific area with the lasso tool on the map.
How to use the tool
Map Layers
You can change the base map and how the data is displayed on the map by hovering your cursor over the layers icon, which is in the top right corner of the map panel.
Date Selector
Above the charts is the Date Selector. Data in the map and charts are filtered between the dates shown in the date selector. The date filter defaults to accidents in the last five avalanche years. An avalanche year is October 1 - September 30, and the avalanche year 2023 ends on September 30, 2023. The Avalanche Explorer can display fatal avalanche accidents in Colorado from December 2009 to the present.
Clear Filters
There are two spots to clear filters in the map. One is the bottom left of the map buttons. The other is just to the left of the date selector. Clicking the Clear Filters button will reset any selections made in the charts, clear the lasso filter, and restore the range of dates to the last five avalanche years. It will also reset the zoom of the map to the original zoom level.
Charts
The application includes six interactive charts: travel mode, avalanche type, an avalanche rose, R scale, D scale, and month. Clicking on a category in a chart will filter the accidents displayed on the map. The charts will also update their numbers when a filter is applied from the date selector, lasso tool, or another chart. Click on any of the bars or labeled categories to select only data in that category. The filters are stackable, meaning that multiple charts can be used to filter. When you click on a chart, it keeps track of the order of the filtering and changes the label at the top of the chart. For instance, if you first select the Hard Slab avalanche type and then the Snowmobile travel mode, the chart titles will keep track of how many accidents were filtered in the first filter, then in the second filter, and so on. To clear all the filters, click on the Clear Filters Icon at the top of the chart panel.
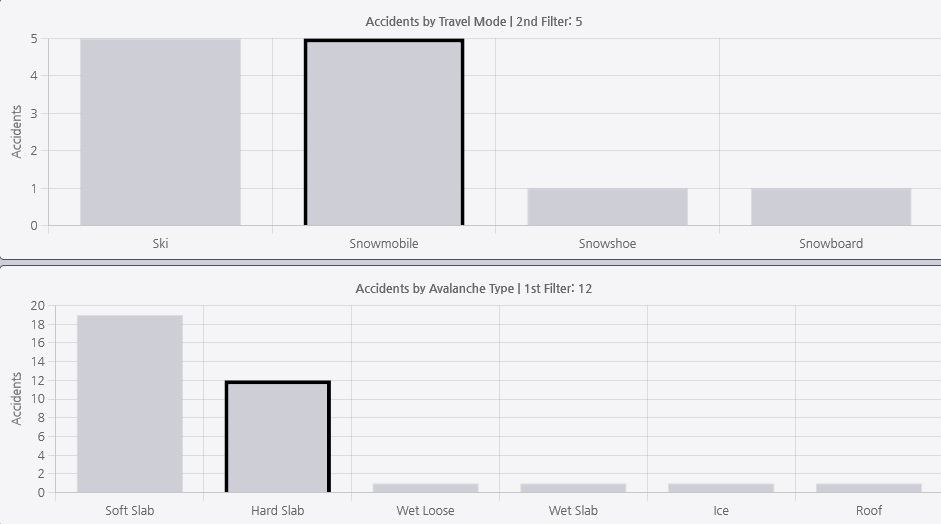
Once a chart filter is applied, you can also reset the filter by clicking on a different category in a parent chart of the filtering. With the example above, Avalanche Type is the first filter. If you click on a different Avalanche Type category, such as Soft Slab, any subsequent or secondary filters (in this case, Travel Mode), will be cleared. In all charts except the Avalanche Rose, selecting another bar or category will switch to that type of avalanche accident and deselect the previous type. Changing the date range will also clear the filtering in the charts and reset the map to all accidents between that date range.
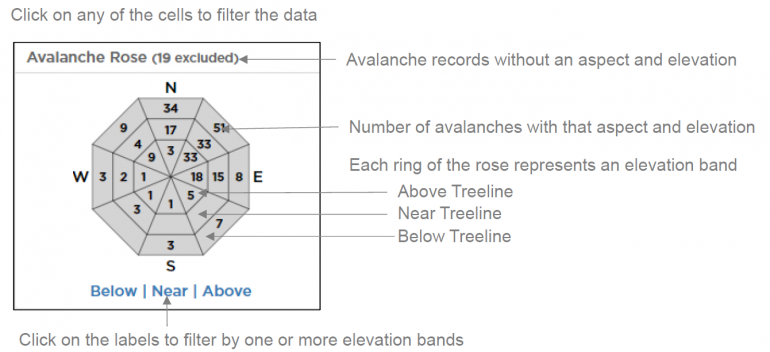
The Avalanche Rose shows data by aspect and elevation band (below/near/above treeline). You can filter the accidents shown on the map by clicking on the cells within the rose diagram. You can select one elevation band by clicking on the labels below the rose diagram (Below | Near | Above). You can select multiple elevation bands by clicking on the pipe (|) between the labels.